milieau.03 setting up the milieau dataset
Initial inspection
First off, opening the avoindata.fi site for the dataset I was met with two terms I didn’t know the meaning of: WFS-interface and OGC API -interface. More on those later. Then I tried opening all the links.
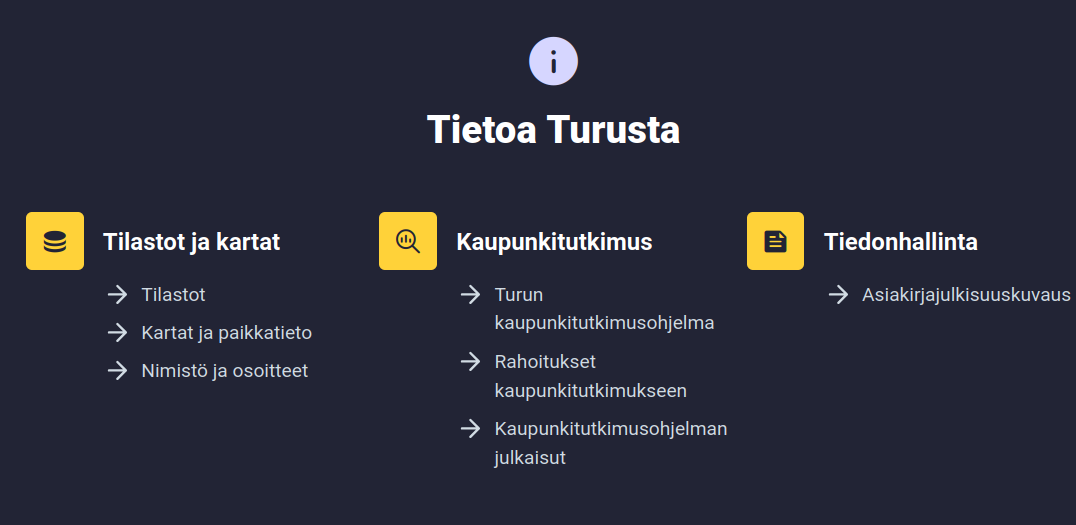
“Avoimet paikkatietorajapinnat” led to a generic page “tietoa turusta”.
Also available in english and swedish:
 Which has further links to information about the interfaces. For my agenda the Maps and geographic information is the only relevant one, but I browsed most of the sections with differing levels of thoroughness, as one does. The statistics on Turku population and area were quite interesting and well presented.
One point relating to living may be interesting to my agenda: Price per square meter of “old condos” were at their highest point in 2022, but prices have declined since. I located this information in the larger report toimintaympäristöanalyysi kevät 2025, which cites on page 47: “Lähde: Tilastokeskus, Stat-Fin-tilastotietokanta; asuminen, vanhojen osakeasuntojen neliöhinnat”.
And OMG, Tilastokeskus has so many tables on property values! I thought this was somehow secret knowledge. Most if not all are only available in finnish, though.
Here’s some links as examples:
StatFin/Osakeasuntojen hinnat: this is a full list of currently up to date datasets on the prices of housing properties.
Asuntojen myynti- ja vuokrailmoitukset (rental and for sale property listings [!!!!]) Here can be found for example the number of for sale listings per area. There are 3 different areas for Turku, I’m not sure which is which.
Correction: they are listed via postal codes:
| area | postal code |
|---|---|
| Turku-1 | 20100, 20500, 20700, 20810, 20900 |
| Turku-2 | 20200, 20250, 20300, 20380, 20400, 20520, 20720, 20880, 20960 |
| Turku-3 | Muut postinumeroalueet |
Source: Suomen virallinen tilasto (SVT): Osakeasuntojen hinnat [verkkojulkaisu].
ISSN=2323-878X. Helsinki: Tilastokeskus [viitattu: 25.11.2025].
Saantitapa: https://stat.fi/til/ashi/ashi_2018-05-02_luo_001_fi.html
For my use case the granularity of locations is too coarse, the milieau sectors change multiple times across those postal numbers. But it might still be interesting for some analysis!
Here is a list of transacted properties with more granular locations and more information about the attributes of the apartments: https://asuntojen.hintatiedot.fi/haku/?c=turku&cr=1&ps=&nc=0&amin=&amax=&renderType=renderTypeTable&search=1
Heres a screenshot from that table, quite nice!:
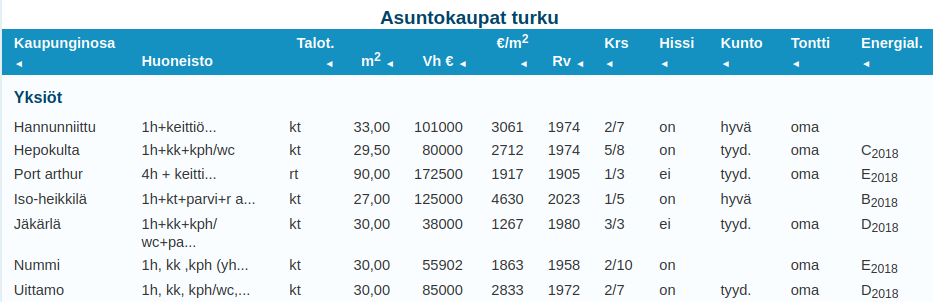
Still, not as granular and there is no information about when the properties were transacted, atleast I didn’t find it. Correction: The properties listing transactions happened 1-12 months of present day. Over a year old transactions are scrubbed from the set! This is great for me then, because I don’t have to worry about old listings messing up the prices.
Another interesting site I found (which has almost nothing to do with this project) is that Tilastokeskus publishes articles and blogs about statistics, information and trends: https://stat.fi/tietotrendit. Definitely something to look into.
Let’s get back on track with turku.fi
Article about Turku geolocation interfaces and publishing principles: https://www.lounaistieto.fi/data-tutuksi-turun-kaupungin-paikkatietorajapinnat/
Toivomme aineistojen tuovan paljon iloa hyödyntäjilleen ja niiden poikivan paljon uusia sovelluksia kaupunkilaisten iloksi ja hyödyksi!
Infomation about map interfaces: https://blog.edu.turku.fi/karttanyt/artikkelit/tietoa-rajapinnoista/
map interfaces Turku: https://www.avoindata.fi/data/fi/dataset/turun-kaupungin-paikkatietoja
overall about maps and gis in Turku: https://www.turku.fi/tietoa-turusta/kartat-ja-paikkatieto
milieau related report about sensoral experiences in linnakaupunki neighbourhood: https://www.turku.fi/sites/default/files/document/tutkimuskatsauksia_3-2025.pdf
WFS and OGC api
WFS = Web Feature Service OGC = Open Geospatial Consortium
Turku city edu blog has good instructions on using them, because right now they seem a bit esoteric. https://blog.edu.turku.fi/karttanyt/artikkelit/tietoa-rajapinnoista/
I know that Python can be used for GIS, but I’m unsure how difficult is it to make WFS requests, and how to use the request results in some smart way.
Here are a couple tutorials:
https://automating-gis-processes.github.io/2016/Lesson1-Intro-Python-GIS.html https://pythongis.org/part2/chapter-09/nb/01-retrieving-data-from-wfs.html
The Helsinki Uni tutorial is from 2016, so I won’t be using that! The Python for Geographic Data Analysis has copyright 2020-2025, so it should be more up to date.
Learning GIS with Python
I’ll try to speed through the tutorial / course / book https://pythongis.org/part1/index.html (All links in this section point to content which: © Copyright 2020-2025, Henrikki Tenkanen, Vuokko Heikinheimo, David Whipp.), skimming through the python parts and focusing on visualization, data manipulation and the OGC apis.
I know that I have worked with GeoPython and matplotlib etc on the IoT big data course, but it has already been a couple years and I don’t remember much of what I did then.
I skimmed through the Python essentials part of the course and it seems that especially the pandas and matplotlib sections will be useful once I need to start making graphs for analysis. But thats in the future.
Vector data model = constructed from points in geographical space which are then connected to each other forming lines Raster data model = constructed from pixels
Querying the milieau data:
- Most likely: I need to convert the postal addresses from the property listings into coordinates, which can then be used to query whether or not the address is in which milieau sector on the map, then write another field to the listing datapoint describing part of which sector it is.
geopandas:
https://pythongis.org/part2/chapter-06/nb/01-geodataframe.html#creating-a-geodataframe-from-a-text-file
#Coordinates are mapped to geometry-points with:
geopandas.points_from_xy(x,y)

GeoDataFrame()
'''is the data structure which contains geographical data, its build from the pandas DataFrame() type, so GeoDataFrame() only accepts DataFrame() type as an input
'''

#They can be then plotted using
GeoDataFrame.plot()
Unary union: You get the full outline of multiple geometric entities in your data, which could be useful to check whether or not a coordinate is inside or outside the milieaus, as opposed to checking each one individually.
bounding polygon: Gets the smallest square that envelops the data for preliminary data selection.
buffer: could be useful for rounding/expanding milieau sectors as in real life the sectors don’t just stop and start at a crossing but drift into eachother, I suppose.
Map projections: I’ll worry about map projection errors, if I have to. I suppose the error shouldn’t be that big when we are talking about a map that is approx 5 km². If something seems funky with the projections I’ll fix it! Interesting point is there being multiples of coordinate systems which function differently to each other.
geocoding
here we get to an old favourite subject. things to look out for:
-
free api keys might be rate limited Nominatim allows for 3600 requests per hour using openstreetmap
-
because it is rate limited is it better to make the crawler return each listing individually so geocoding is running concurrently rather than batch processing. (It depends on how fast the crawler is! If it is really fast it doesn’t matter, but slow crawler requests would benefit from the geocoding function to run in another thread. I can also limit the crawler speed so that it isn’t such a weird load on the website)
spatial queries
Here we have the functionalities for figuring out whether objects are intersected or contain or touch etc each other.
here are the .shapely library calls
here is exactly what I will be doing: examining whether or not points on a map are contained in polygons on a map. Actually: the next section, spatial join, is possibly more fitting.
For me the Inner join method would be the most effective, because it accepts data on the intersections (also on the edge of a polygon) while excluding all data which isn’t intersecting, ie which is outside all milieau sectors.
As a first step before making a spatial join, it is always good to check that the coordinate reference system (CRS) of the layers are identical. The basic requirement for a successful spatial join is that the layers should overlap with each other in space. If the geometries between the layers do not share the same CRS, it is very likely that the spatial join will fail and produces an empty
GeoDataFrame– https://pythongis.org/part2/chapter-06/nb/06-spatial-join.html#preparations-for-spatial-join
data classification would be useful when I start to look at the data. There’s also examples of bar charts and heatmaps etc
geo visualization using python Very useful!
online geograpic data sources
This is what I actually needed to originally know. Learned a lot just to get here, but I’d say it was worth it!
Testing osmnx functionality
First I began by downloading osmnx with pip to my venv and after that trying to run a simple script:
import osmnx as ox


place = "Kamppi, Helsinki, Finland"

aoi = ox.geocoder.geocode_to_gdf(place)

aoi.explore()

## result
'''
(mil-env) karri@karri-ThinkPad-P1-Gen-3:~/milieau-analysis$  /usr/bin/env /home/karri/milieau-analysis/mil-env/bin/python /home/karri/.vscode/extensions/ms-python.debugpy-2025.16.0-linux-x64/bundled/libs/debugpy/adapter/../../debugpy/launcher 45819 -- /home/karri/milieau-analysis/analysis/testing/osmnx.py
Traceback (most recent call last):
  File "/home/karri/milieau-analysis/analysis/testing/osmnx.py", line 1, in <module>
    import osmnx as ox
  File "/home/karri/milieau-analysis/analysis/testing/osmnx.py", line 4, in <module>
    aoi = ox.geocoder.geocode_to_gdf(place)
          ^^^^^^^^^^^
AttributeError: partially initialized module 'osmnx' has no attribute 'geocoder' (most likely due to a circular import)
First edit is to change the filename to something else than osmnx.py…
I also needed to download other dependencies for .explore() method. Heres my current requirements list:
(mil-env) karri@karri-ThinkPad-P1-Gen-3:~/milieau-analysis$ pip freeze requirements.txt
branca==0.8.2
certifi==2025.11.12
charset-normalizer==3.4.4
contourpy==1.3.3
cycler==0.12.1
folium==0.20.0
fonttools==4.60.1
geopandas==1.1.1
idna==3.11
Jinja2==3.1.6
joblib==1.5.2
kiwisolver==1.4.9
mapclassify==2.10.0
MarkupSafe==3.0.3
matplotlib==3.10.7
networkx==3.6
numpy==2.3.5
osmnx==2.0.7
packaging==25.0
pandas==2.3.3
pillow==12.0.0
pyogrio==0.12.0
pyparsing==3.2.5
pyproj==3.7.2
python-dateutil==2.9.0.post0
pytz==2025.2
requests==2.32.5
scikit-learn==1.7.2
scipy==1.16.3
shapely==2.1.2
six==1.17.0
threadpoolctl==3.6.0
tzdata==2025.2
urllib3==2.5.0
xyzservices==2025.11.0
It’ll probably grow, and the updated version is in version control.
After those the script works and outputs a html file that can be opened in my browser.
(mil-env) karri@karri-ThinkPad-P1-Gen-3:~/milieau-analysis$ firefox data/kamppi_aoi.html
Retrieving fata from WFS
The first example from the book works, once I installed the missing dependencies.
Converting to gpkg works too. Now I need to check that I can retrieve the gpkg data from file. After which I can try and download the milieau data and save it to file.
Voíla! Here is the tilastointialueet.gpkg dataset on the OpenStreetMap background. “analysis/testing/testretrievegpkg.py” is the program file.

This means I can move onto using the milieau dataset!
retrieving the milieau dataset
I modified the example code, in my repo as analysis/testing/testwfs.py to accept the milieau dataset WFS interface. Heres the two files side by side
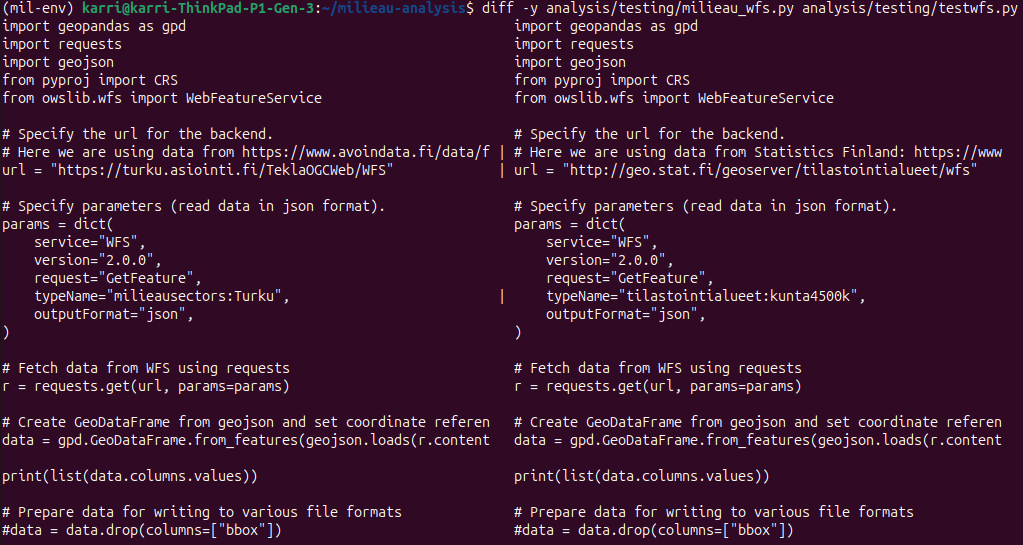
The one on the right with the example dataset works as intended, but the milieau dataset returns an error:
(mil-env) karri@karri-ThinkPad-P1-Gen-3:~/milieau-analysis$  cd /home/karri/milieau-analysis ; /usr/bin/env /home/karri/milieau-analysis/mil-env/bin/python /home/karri/.vscode/extensions/ms-python.debugpy-2025.16.0-linux-x64/bundled/libs/debugpy/adapter/../../debugpy/launcher 53517 -- /home/karri/milieau-analysis/analysis/testing/milieau_wfs.py
Traceback (most recent call last):
  File "/home/karri/milieau-analysis/analysis/testing/milieau_wfs.py", line 24, in <module>
    data = gpd.GeoDataFrame.from_features(geojson.loads(r.content), crs="EPSG:3067")
                                          ^^^^^^^^^^^^^^^^^^^^^^^^
  File "/home/karri/milieau-analysis/mil-env/lib/python3.12/site-packages/geojson/codec.py", line 51, in loads
    return json.loads(s,
           ^^^^^^^^^^^^^
  File "/usr/lib/python3.12/json/__init__.py", line 359, in loads
    return cls(**kw).decode(s)
           ^^^^^^^^^^^^^^^^^^^
  File "/usr/lib/python3.12/json/decoder.py", line 337, in decode
    obj, end = self.raw_decode(s, idx=_w(s, 0).end())
               ^^^^^^^^^^^^^^^^^^^^^^^^^^^^^^^^^^^^^^
  File "/usr/lib/python3.12/json/decoder.py", line 355, in raw_decode
    raise JSONDecodeError("Expecting value", s, err.value) from None
json.decoder.JSONDecodeError: Expecting value: line 1 column 1 (char 0)
So the json that the call tries to load is empty! Both of the files are in version control.
I’ll check the turku city instructions on using their datasets before I try anything else.
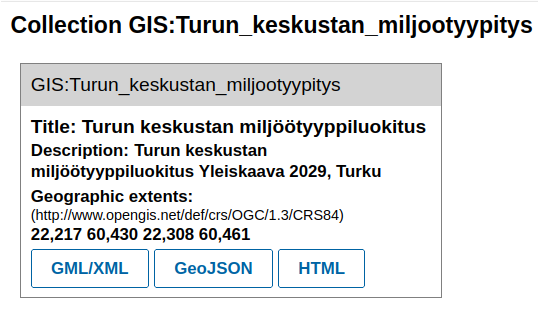
Upon a quick glance the link in the avoindata.fi site is a link to the collection of datasets that turku city offers!
I’m using this finnish language tutorial on how to use the turku city GIS interfaces:instructions. It is written to be used with QGIS application. I didn’t reallly find a list of the WFS headers, or a which parameters I should use.
So I think the problem with my code currently is that I don’t know what to request! I won’t fight over what to request with WFS, since all of the collections are listed though the OGCapi: https://turku.asiointi.fi/trimbleogcapi/collections?f=text%2fhtml. They are all available as GML/XML, GeoJSON and HTML:
 I’ll try to retrieve the GeoJSON file programatically and load it into a GeoDataFrame:
More errors, for example:
ValueError: setting an array element with a sequence. The requested array has an inhomogeneous shape after 1 dimensions. The detected shape was (9,) + inhomogeneous part.

and

GEOSException: IllegalArgumentException: Points of LinearRing do not form a closed linestring
The first one comes when trying to retrieve the geojson to a gdf directly, like in the example.
The second comes when I wrote the geojson first to a file and then try to load it with gdp.read_file()
Sigh! The dataset seems to have unclosed rings, meaning that the polygons aren’t completely stitched together.
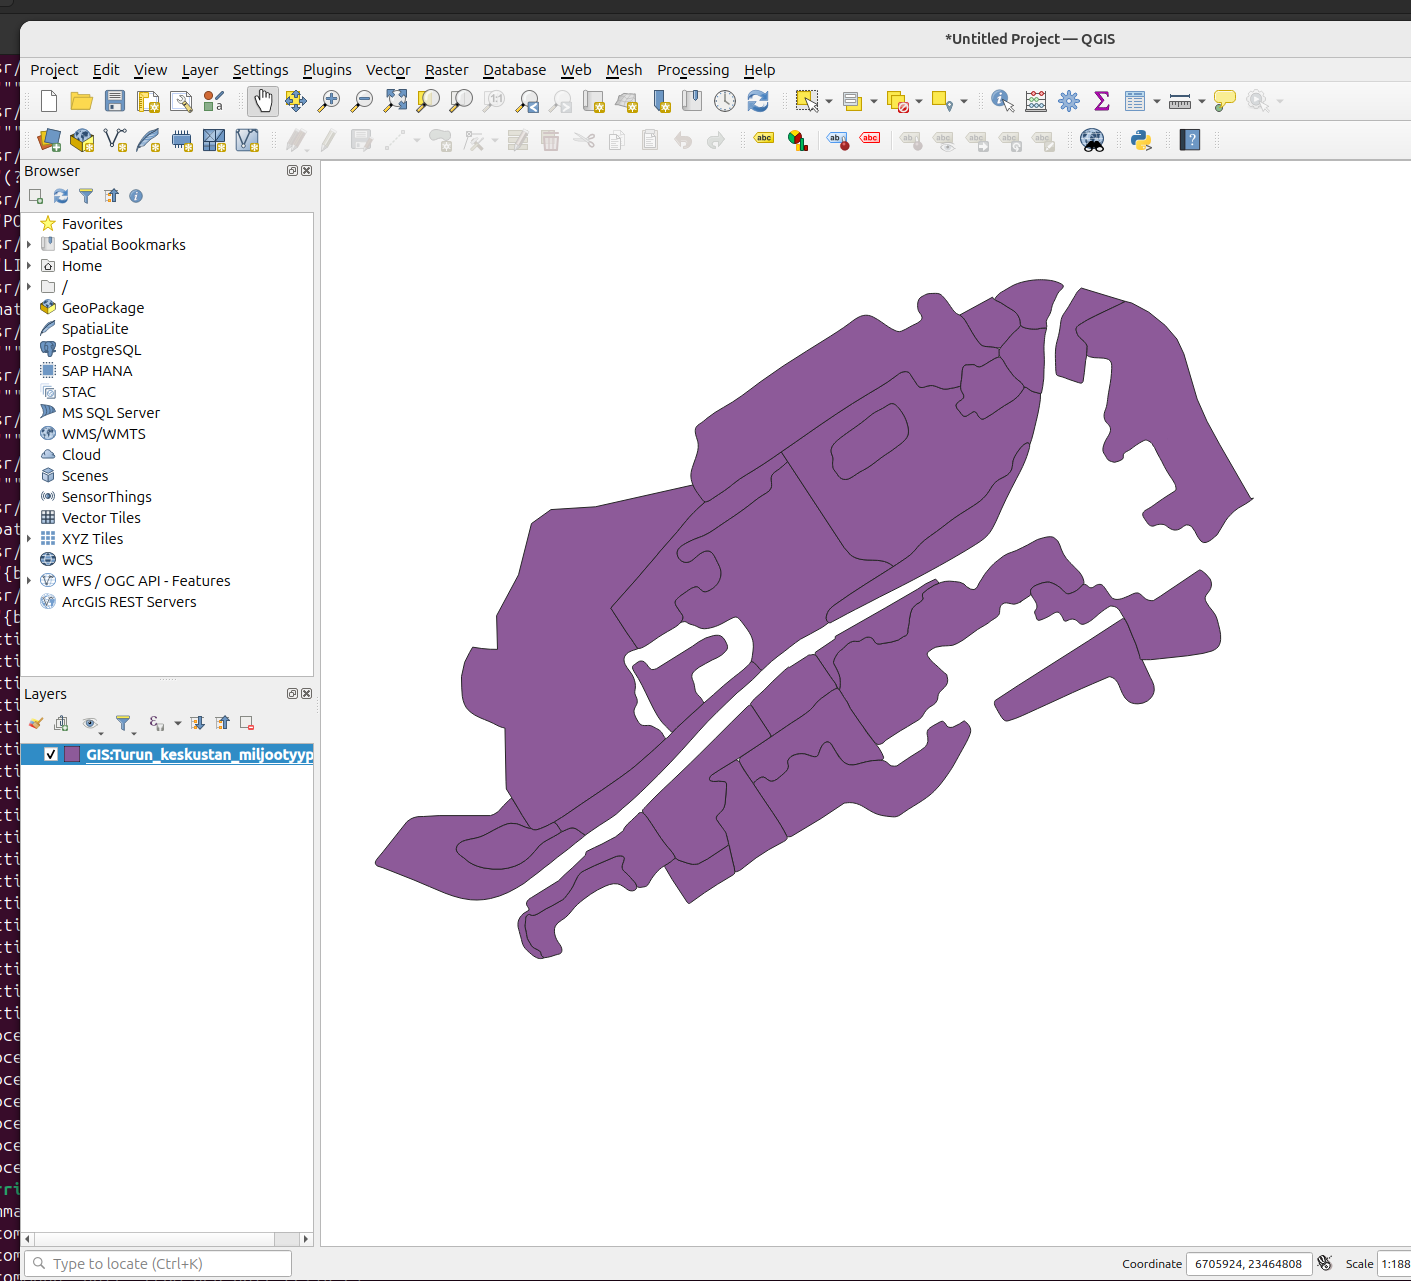
No, it doesn’t. I checked visually and all at least the ones I checked are closed. I also installed QGIS as a (dignified?) form of defeat, and the dataset worked out of the box there:
 Quite frustrating, but more on that later. Maybe I can export the data to gkpg from qgis.
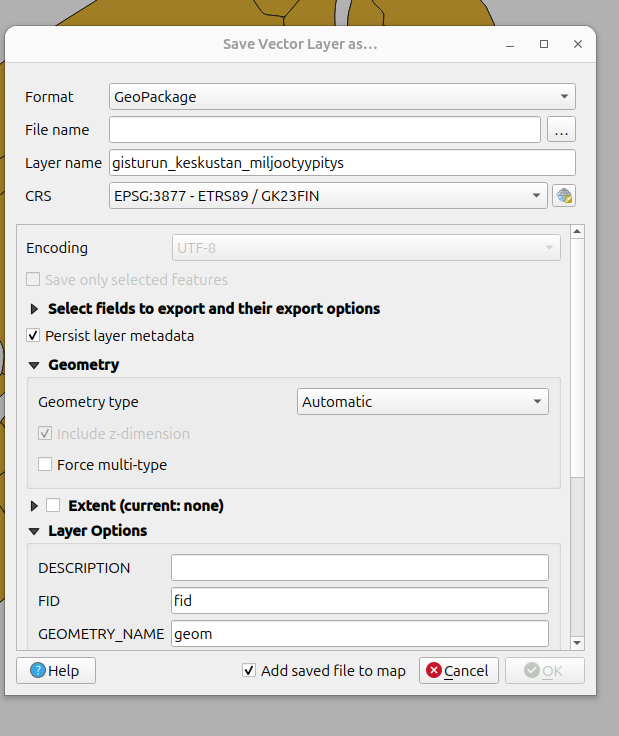
Exporting to gpkg
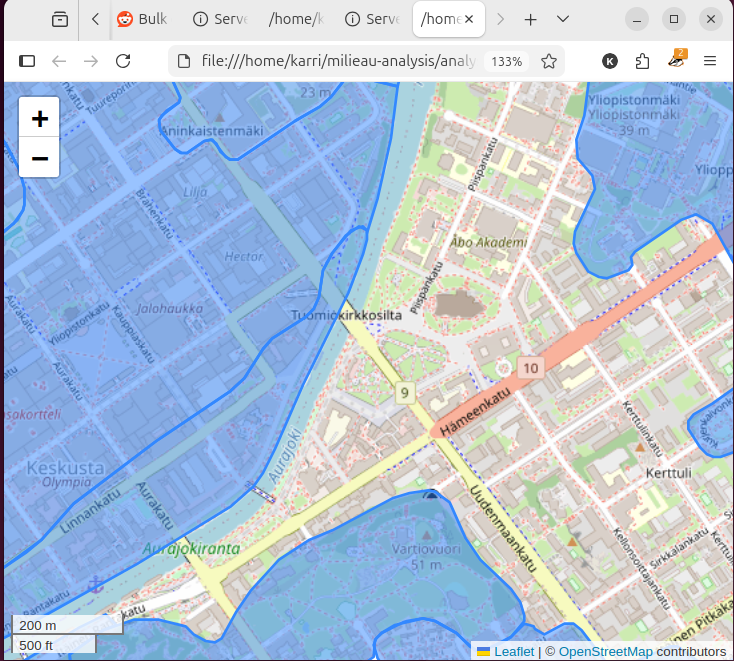
I was able to export the layer to geopackage format, with help from this tutorial. In short Processing Toolbox/Layer tools/export. But when I did and ran it through my analysis/testing/milieau_repr.py file the result looks like this:
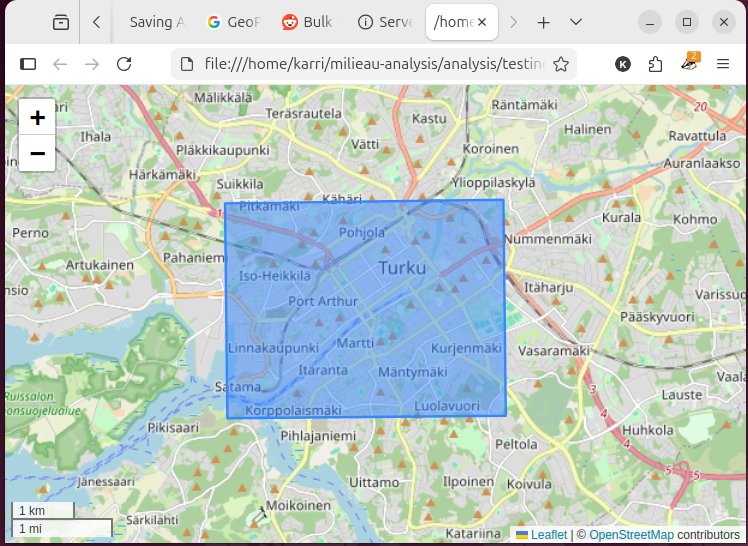
A success in many ways! But I suppose it only exported the size of the layer without the polygons. I’m not sure what went wrong here, but I don’t care enough to figure out, so, onwards:
 Wha-blam! With these simple steps you can be a winner too:
 Click the layer with r-mouse, select export, save features as -> and from there it should look like this:
 Where you can set the parameters to your liking. I only set the filename, as the CRS was already the correct one.
Inspecting
Plenty of ideas are filling my head now that I have the dataset open and visualized.
- I think the original milieau report marks ruissalo as part of the milieau sectors, but it isn’t marked here. (I need to check if this is correct)
- Could I get population densities for each milieau and maybe compare it to the overall number of buildings/apartments in each sector and further normalize the apartment count with the frequency of property listings to find out what kind of trends there are, where do people want to move out from etc.
- There are distinct, large sections of the map which are not covered by the sectors. I need to check with the report what is the reason they are omitted.
- I have a suspicion that they are as sections too varied and therefore can’t be pigeonholed as a certain type of milieau.
- Could I use the lack of milieau as a factor in property values? Ie: the environment isn’t a part of any milieau, therefore it is generic, lacking historical context, lacking atmosphere etc, which would affect property values.
 Why is the surrounding area of the cathedral not part of the historical milieau? When that is the historical milieau of Turku, in my opinion.
Here is a screenshot of from the milieau report pp. 77
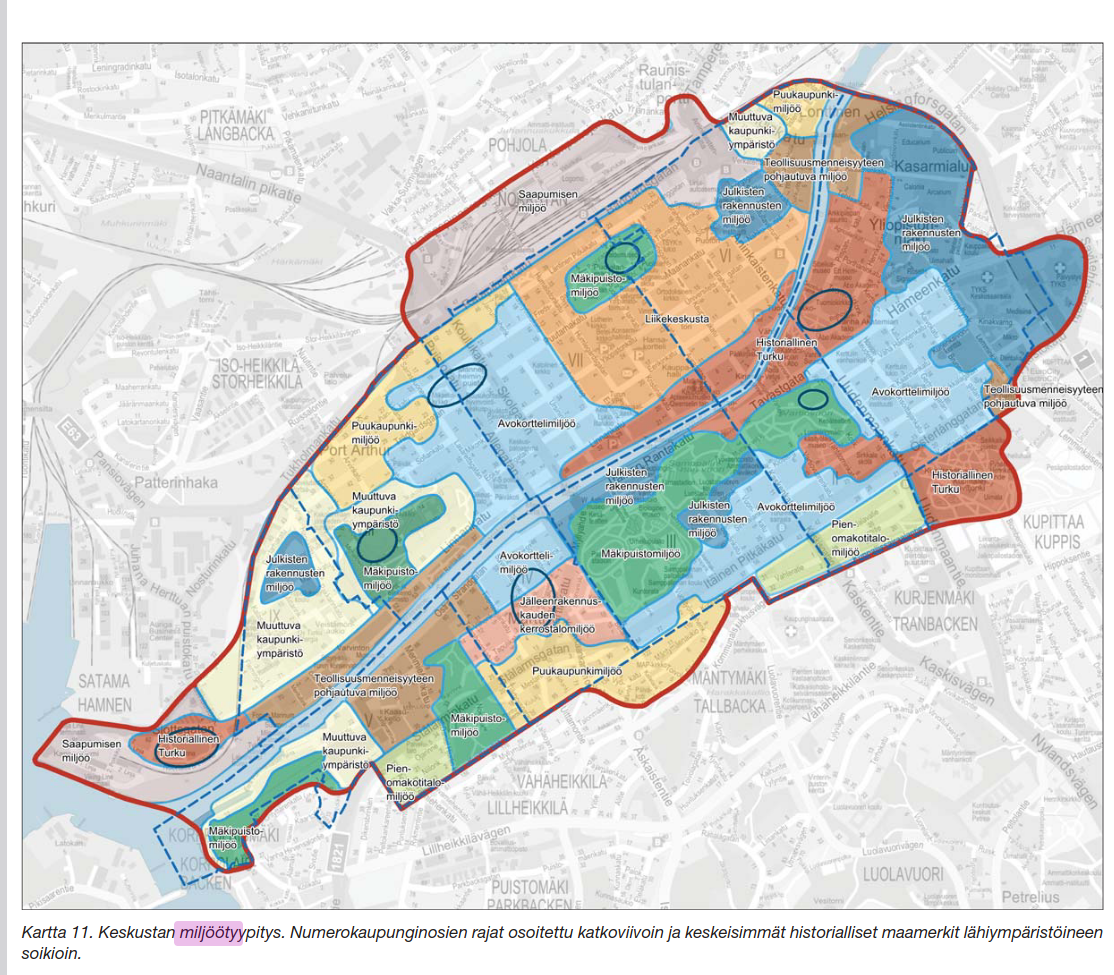 Here you can see that the whole map is covered with milieau types. Maybe I need to get in touch with Turku city about this. Actually, before I do anything, I want to check that the WFS dataset is identical to the OGC dataset that I have used now.
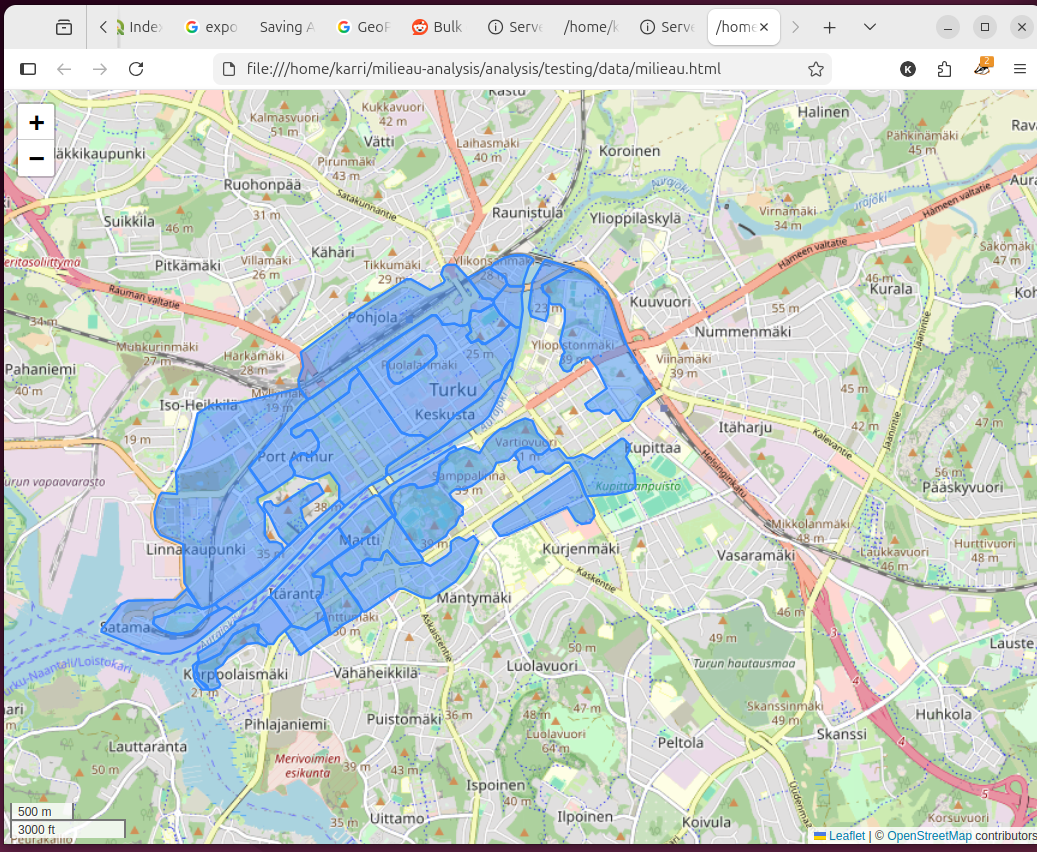
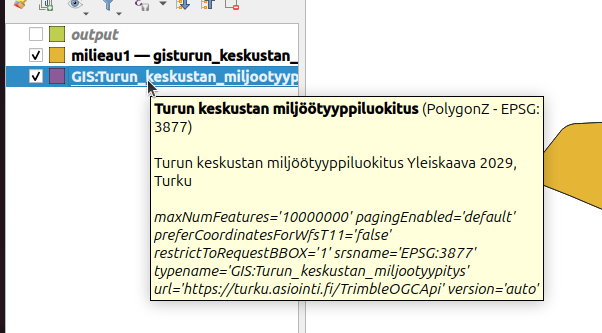
Indeed the WFS and OGC datasets are different!
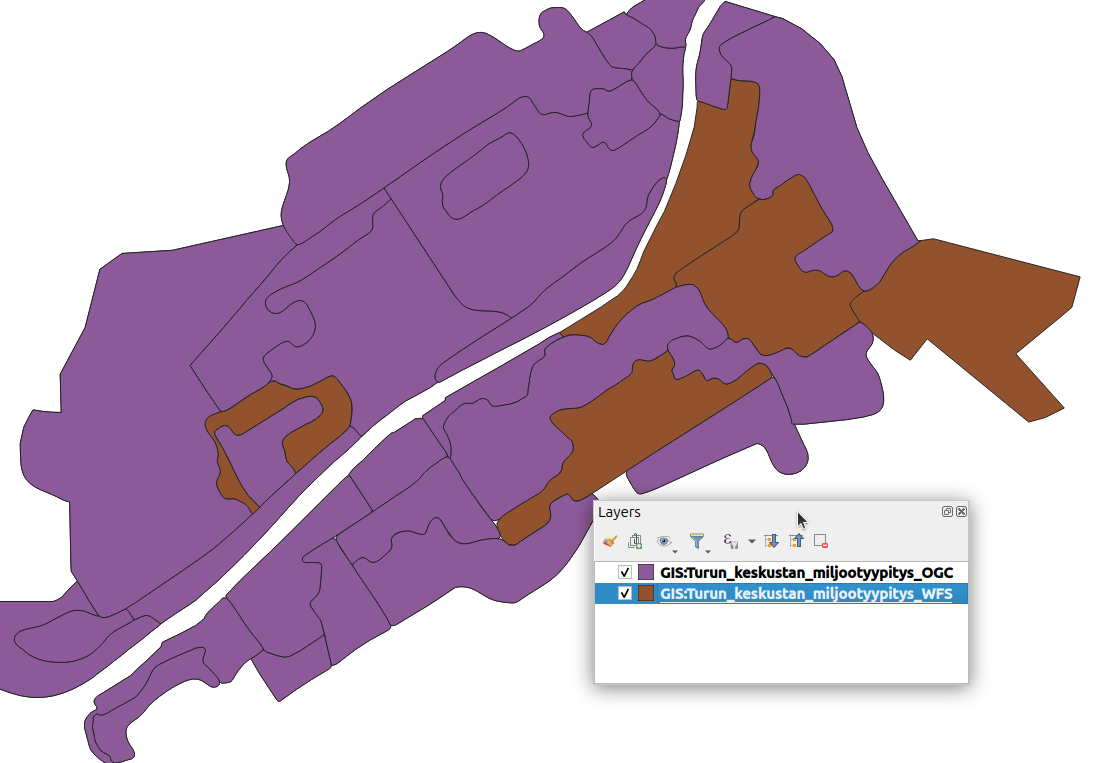 Here we have the two datasets, the OGC in purple and WFS in brown. This is a screenshot from QGIS. I’ll export the correct dataset and contact the city.
I sent an email to the city, I’ll try to remember to report back in one of these posts once they respond.
I’ll export the wfs file to gpkg and make the html map from it:
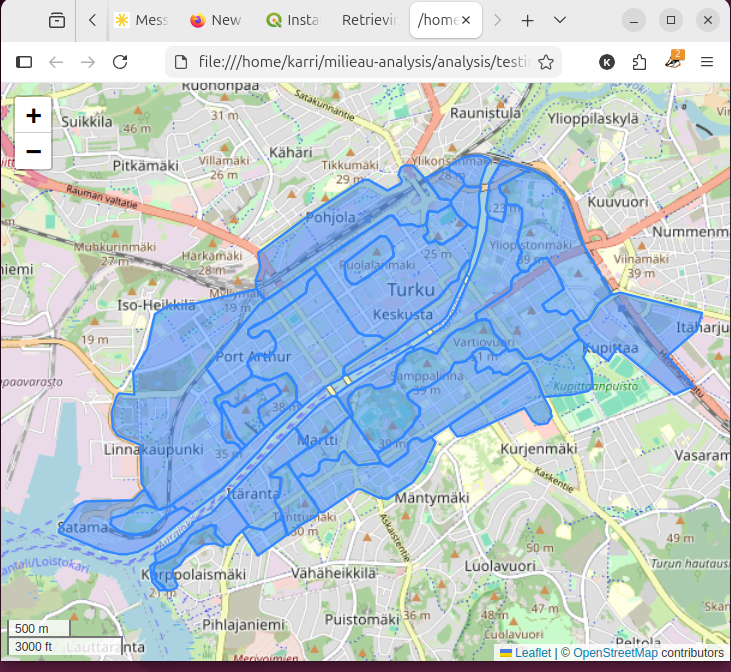
And that probably concludes this post! This is dwindling into process documentation rather than genuine articles, but I’m not that bothered. Next up I’ll design the web crawler!